LiveNX
Easily obtain network-wide observability, advanced analytics, and comprehensive reporting so you can optimize your network performance everywhere.
LiveNX makes it easy to manage multi-vendor network performance:
- Visibility across on-premises, SD-WAN, cloud, and hybrid networks
- Actionable insights to understand what’s happening in real-time
- Flow and packet data to resolve even the most complex issues

What you can do with LiveNX
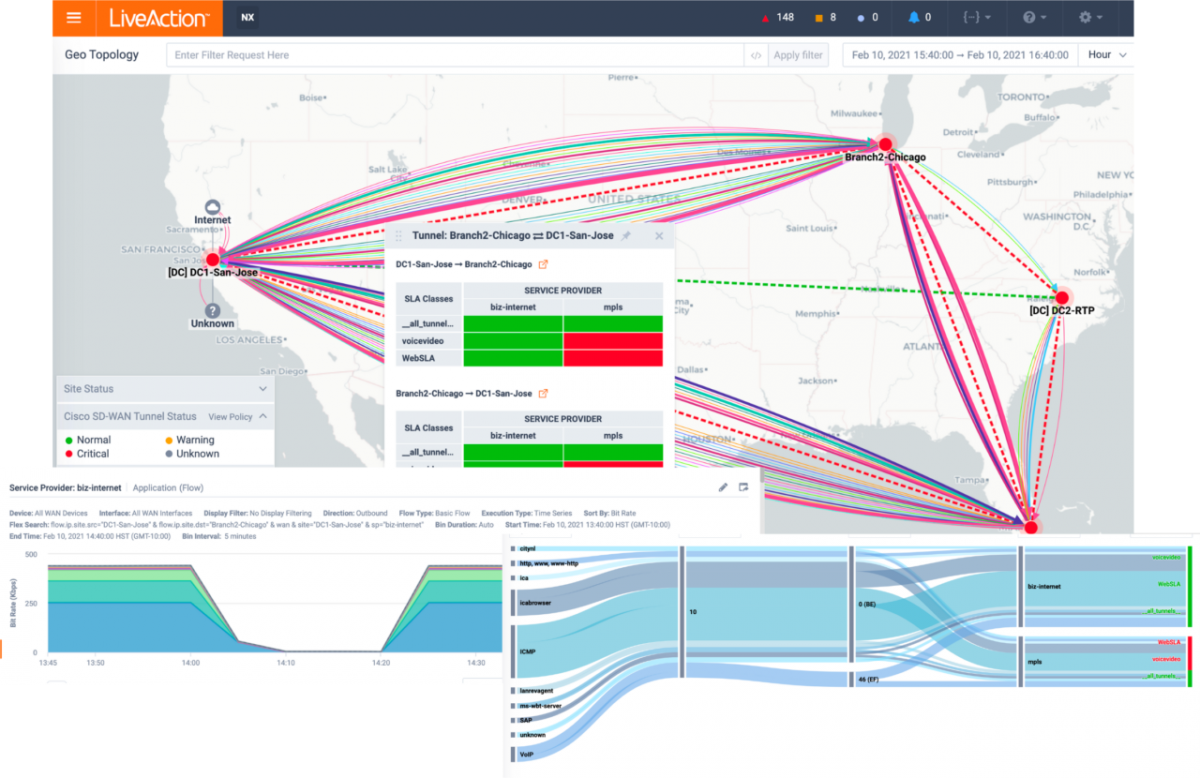
LiveNX automatically discovers all the devices on the network to quickly create a complete inventory of every device and interface in the network. By correlating and analyzing network telemetry, LiveNX provides views, graphs, and maps to illustrate the current state of application and network performance across on-premises, WAN, SD-WAN, remote sites, data centers, and multi-cloud network operations. LiveNX offers network intelligence to see what’s happening on the network in real-time and the actionable insights to address every issue.
LiveNX network observability goes beyond simply visualizing devices, interfaces, applications, VPNs, and users to deliver actionable insights into network and application performance. By overlaying network and application data on top of network topology, LiveNX delivers a clear virtual network model that provides intuitive, visual analytics of network and application performance.
When combined with LiveWire, you can quickly transition from flow to packet analysis for forensic-level troubleshooting, using real-time and historic playback data. LiveWire is designed for use at remote sites, branches, WAN edge, public cloud, and data centers – any place where granular data is required for analysis. By creating flow data from packet data, LiveWire feeds performance data to LiveNX for single-click drill down from flow visualization to packet forensics for detailed root cause analysis of issues.
Application monitoring is integrated into LiveNX, allowing you to gain meaningful insight into the availability and performance of any web-based application, anywhere it is deployed, and address issues before they impact users.
Analyzing disparate network data can be costly and time-consuming, but not understanding the data can lead to an organization under- or over-investing in capacity or network hardware and software, wasting time and resources. LiveNX lets you simplify dashboards and reporting with out-of-the-box standard reports and customizable report templates for NetOps, executives, and capacity planning. Schedule these reports or run ad hoc.
LiveNX provides criteria-specific alerts aggregated from multiple events, displaying only alerts that require immediate attention. In addition, LiveNX uses machine learning for proactive anomaly detection and path change notifications. LiveNX allows you to configure and monitor Quality of Service (QoS) to optimize performance across various devices, applications, and complex networks and supports IP telephony, Cisco QoS classes, and SD-WAN management.
Intuitive performance management for today’s diverse networks:
- See across the entire network. Get complete network and application performance visibility, visual analytics across multi-vendor, multi-domain, and multi-cloud networked environments trom a single plattorm.
- Understand network performance. Know where traffic comes and access the broadest range of network telemetry - flow packet, SNMP, APis, and more - to analyze on-premises, SD-WAN, hybrid, and cloud environments.
- Reduce mean time to respond. Quickly troubleshoot and resolve network and application performance issues across the entire network to speed response and avoid downtime, all while optimizing the user experience.
LiveAction excels at finding and determining the root cause of an issue/incident.


